
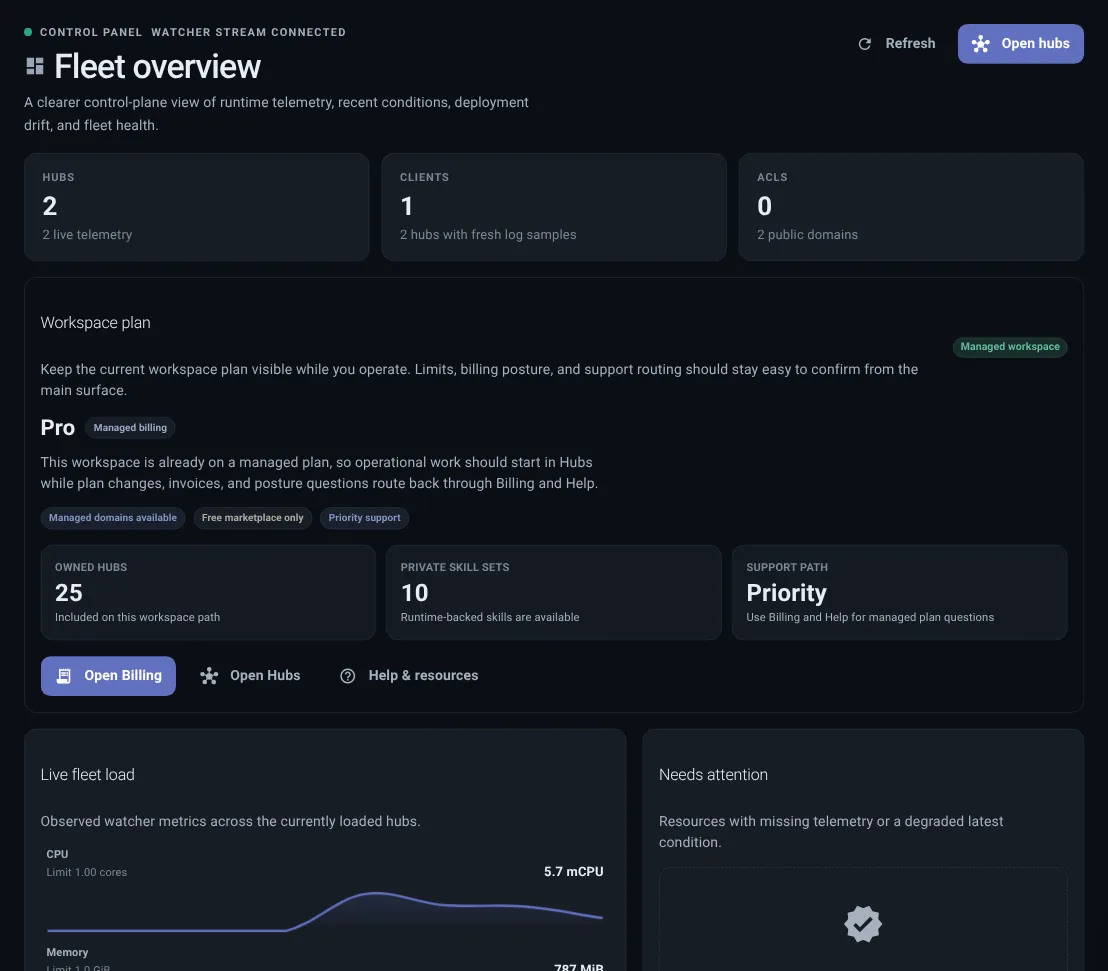
Header metrics
Shows loaded hubs, clients, policies, live telemetry, log coverage, and public domains.
Dashboard is the Fleet overview. It answers: what is loaded, what has fresh signal, and what needs attention?
If you are unsure where to go next, start with Dashboard, then follow How Thalovant Works.
Use Dashboard as a starting point, not as the place to fix every issue. It points you to the page that owns the next action.
| Dashboard signal | First page to open |
|---|---|
| Locked action or plan warning | Billing |
| Missing or stale client | Live Map, then Clients |
| Access warning | Permissions |
| Skill, runtime, or hub update | Manage Updates |
| Activity spike or demand question | Analytics |
| Browser SDK origin pending review | SDK Origins |
| Broad service issue | the status page |
Header metrics
Shows loaded hubs, clients, policies, live telemetry, log coverage, and public domains.
Live fleet load
Shows fresh load only when telemetry is current enough to trust.
Needs attention
Collects hubs or clients with missing, stale, or warning updates.
Fleet snapshot
Shows loaded hubs, client identities, policy coverage, and the current activity window.
Client activity
Summarizes connection churn, utterances, messages, and top active hubs or clients.
Available updates
Highlights skill, runtime, and hub releases when updates are available.
The top of Dashboard summarizes counts such as hubs, clients, policies, live telemetry, log coverage, and public domains. Treat these as a quick pulse, then open the matching page for details.
For a clean review, move through Dashboard in this order:
Sometimes Dashboard can show normal inventory while live status is unavailable. That does not always mean something is broken. Open the related hub, client, Live Map, or Analytics detail to see whether the issue is a missing update, a stale update, incomplete telemetry, or a real warning.
Dashboard looks right when: